UML Diagram
Understanding the units within our system
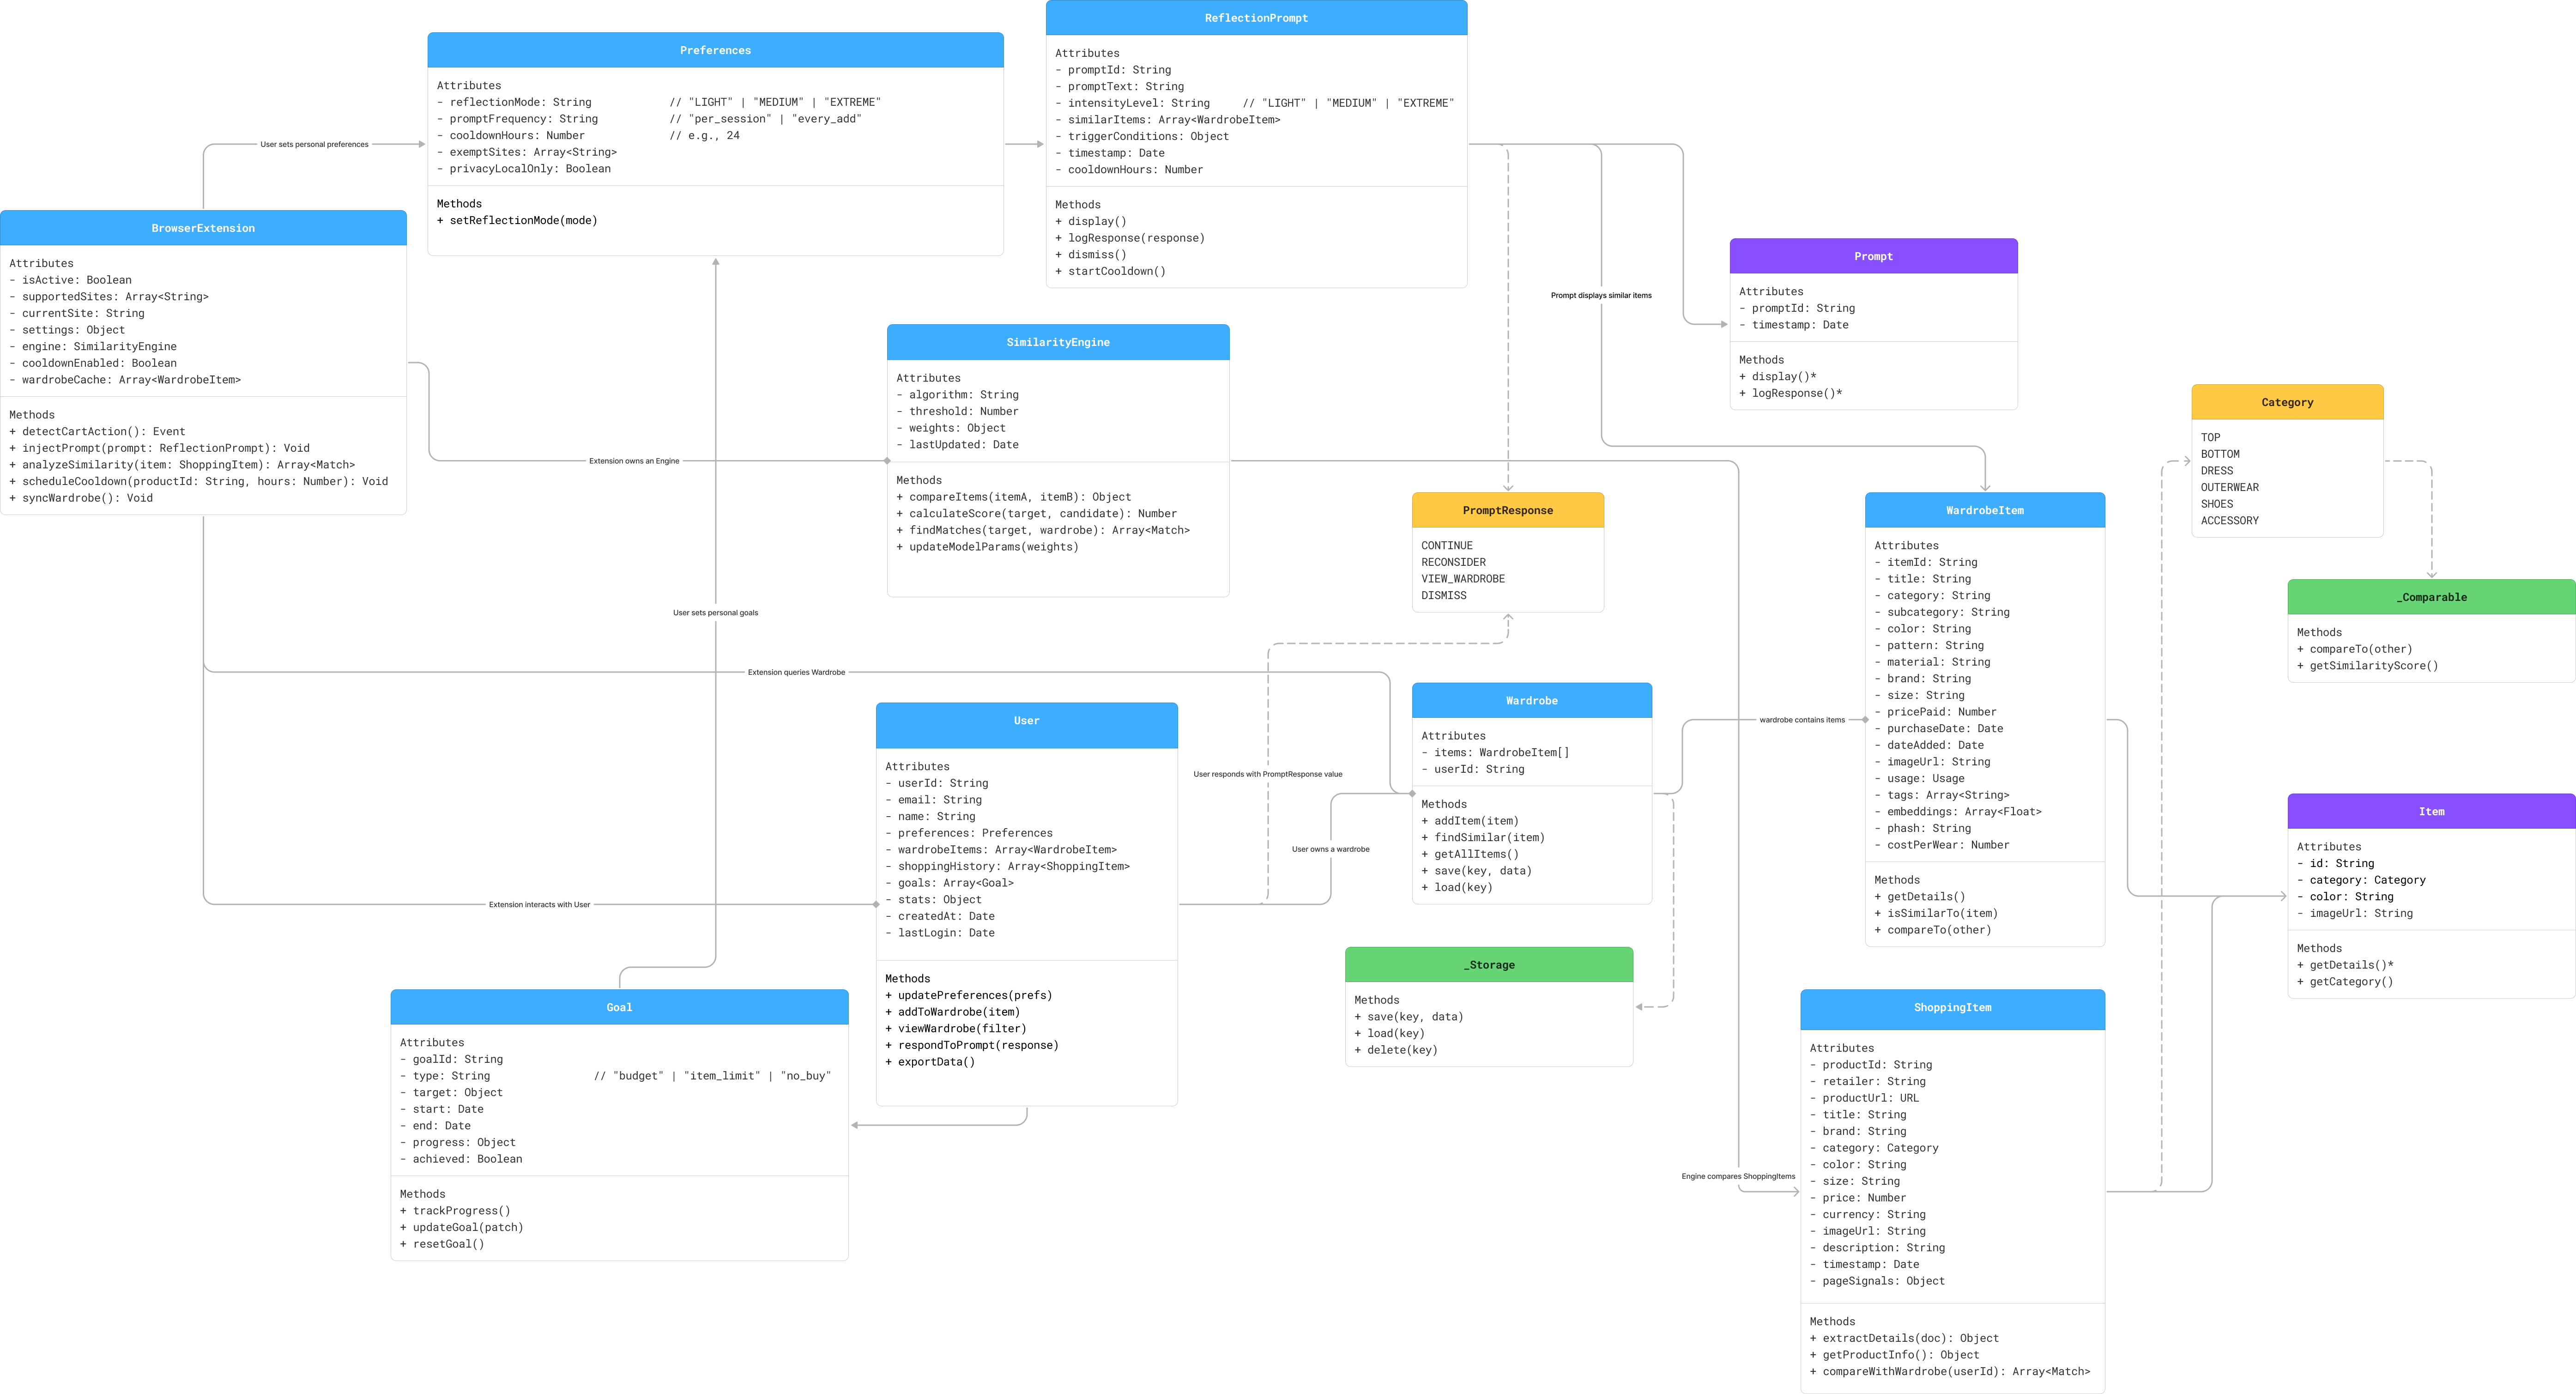
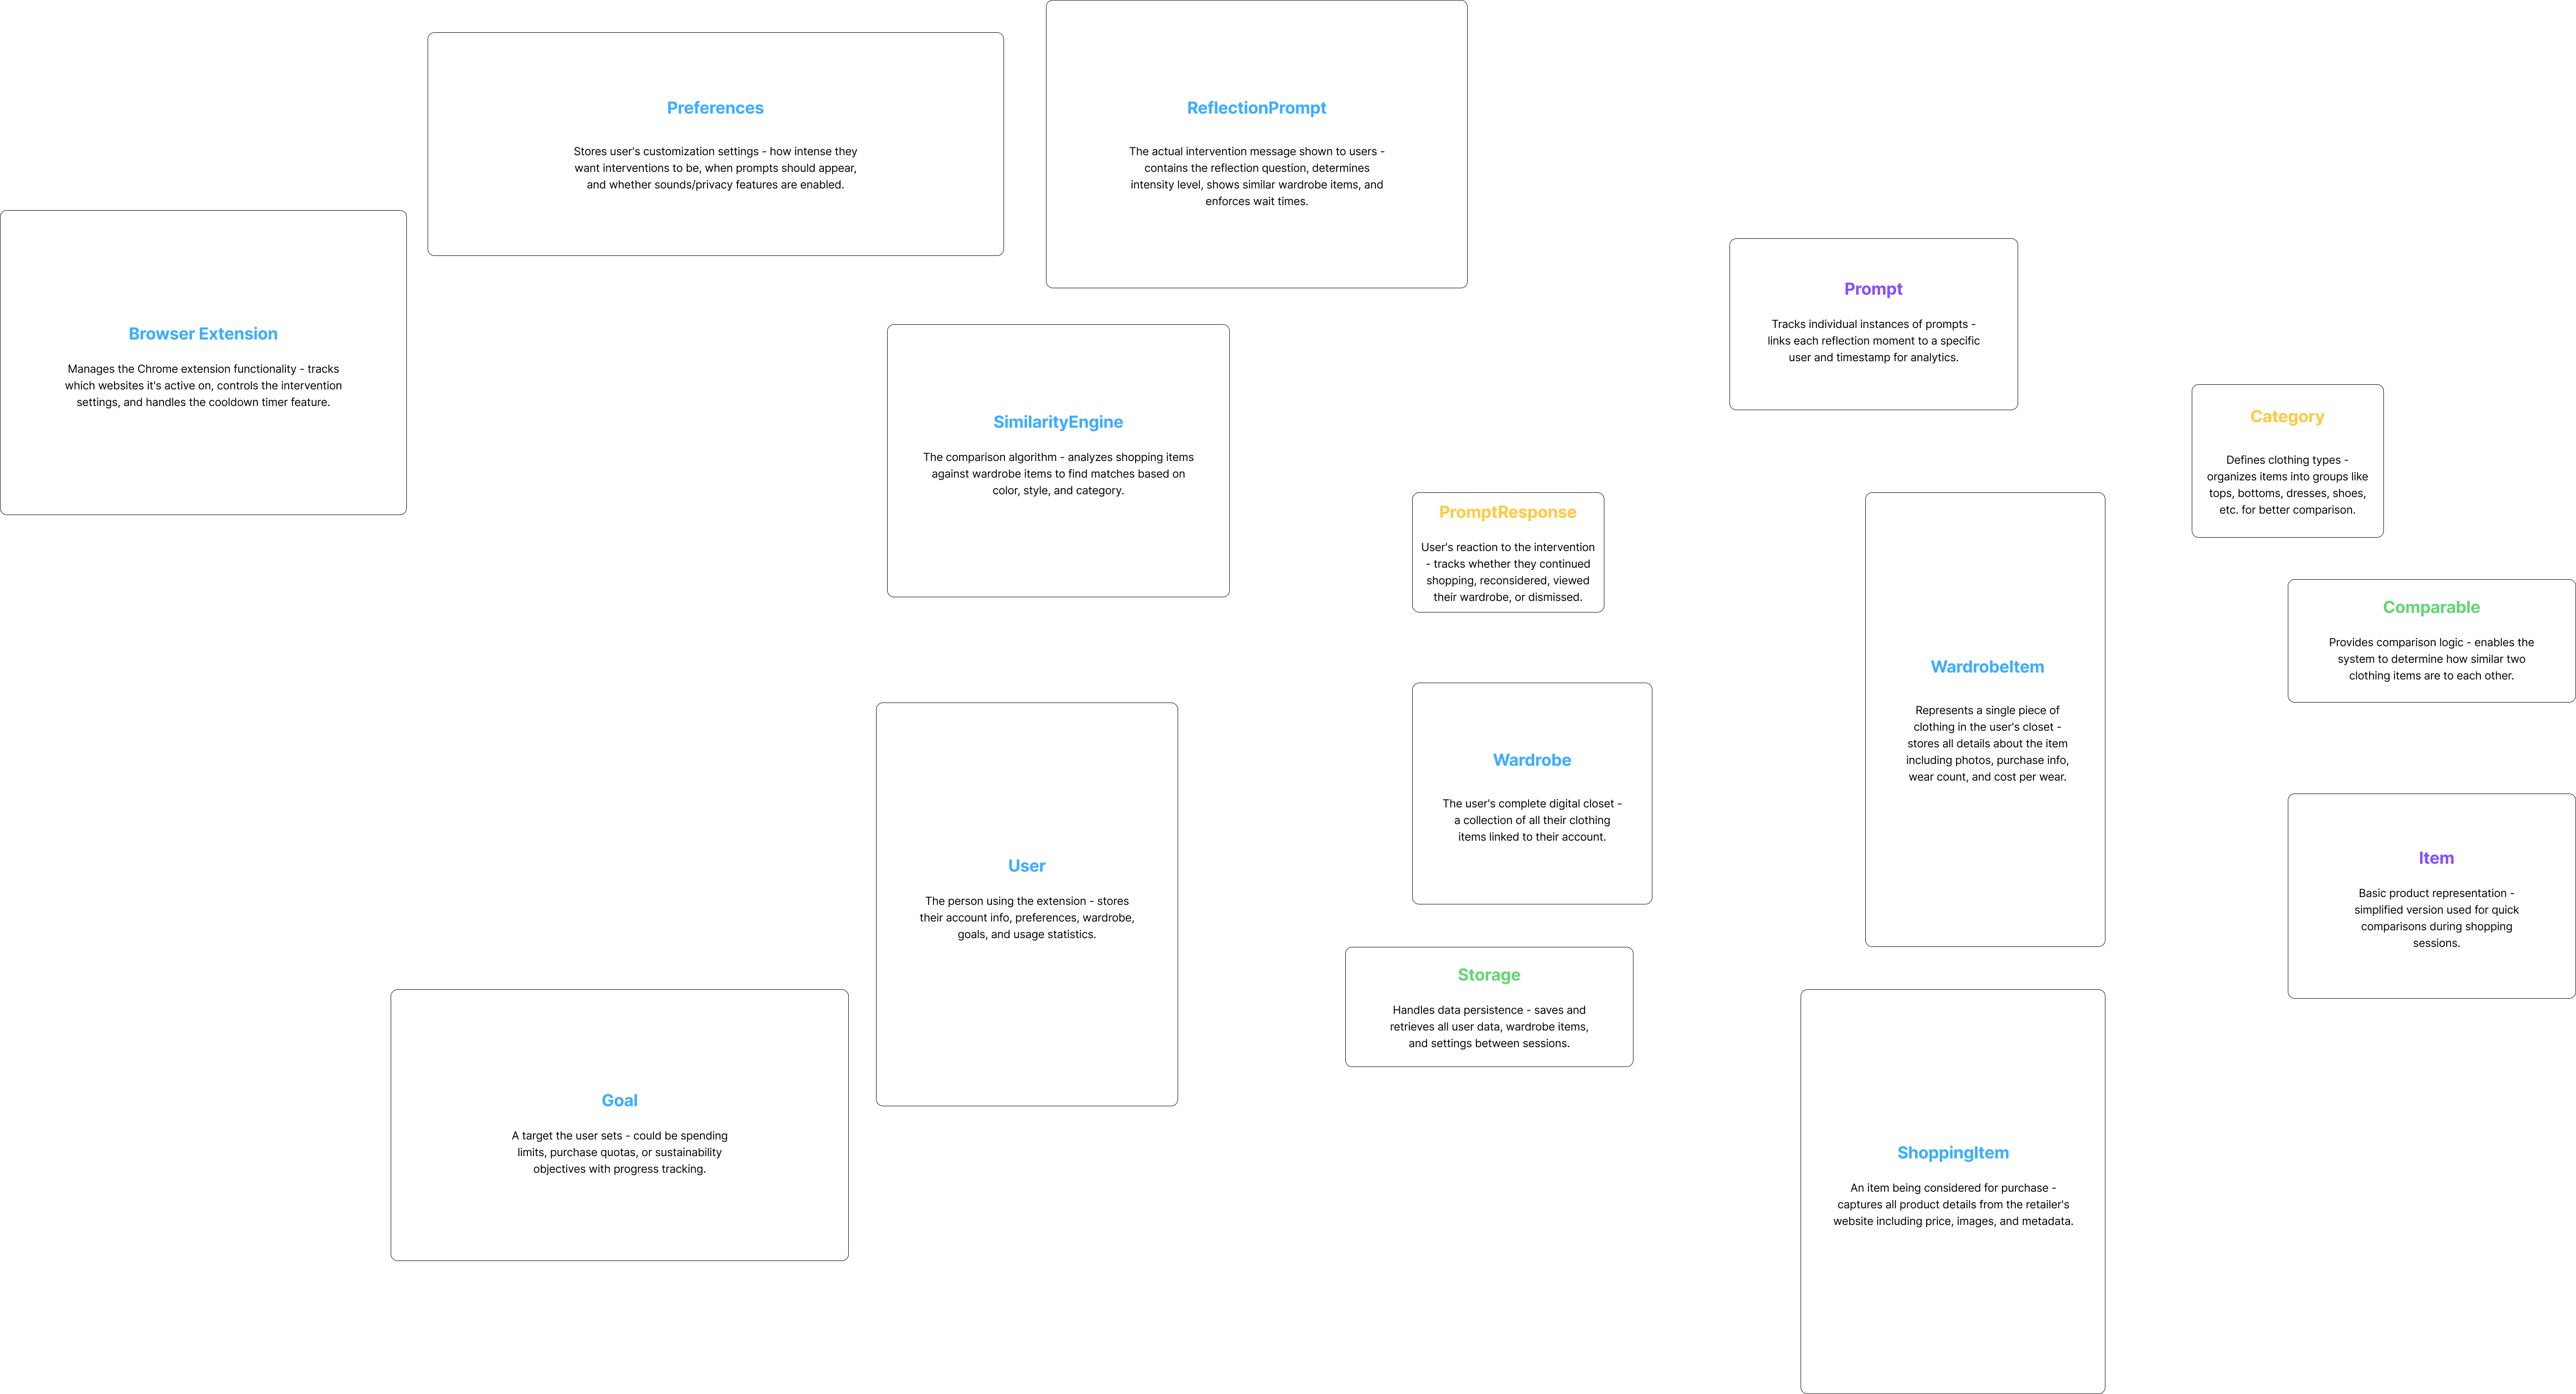
This UML diagram illustrates the key components, relationships, and data flows within the Shopping Speed Bump system. It shows how different classes interact to provide a seamless intervention experience during online shopping.
Key components (hover to reveal details):
Tip: Use both horizontal and vertical scrolling to explore the full diagram. Use zoom controls to focus on specific class relationships and details.
Math Challenges
The Shopping Speed Bump system relies on several mathematical algorithms and computational challenges to provide accurate, personalized interventions. A key innovation is that weights and scoring adapt over time - the system learns from each user's shopping behaviors, decisions, and stated goals to become more personally relevant and effective.
Formula: Similarity = Σ(weighti × matchi) where weights evolve based on user behavior
Adaptive formula: New Threshold = Current Threshold ± (Dismiss Rate × Adjustment Factor)
Personalized learning: Initial weights → User behavior feedback → Goal alignment → Updated weights → Repeat